
When using an oscilloscope or data logging system, how often are you considering, and possibly adjusting, your sample rate? Whether you’re a newbie to using scopes and/or loggers, or you have years of experience with these types of devices, that pesky sample rate parameter still needs to be acknowledged and adjusted accordingly.
Without going down the rabbit hole too far, let’s make sure we are all on the same page. Scopes and data loggers that are collecting/displaying data or waveforms have to “sample” the incoming signal repeatedly so that the device can attempt to replicate the signal for analysis. This means taking little pieces of the signal so that it can hopefully be reassembled to display the larger picture, like a jigsaw puzzle if every piece was to be put together in a certain order to complete the picture.
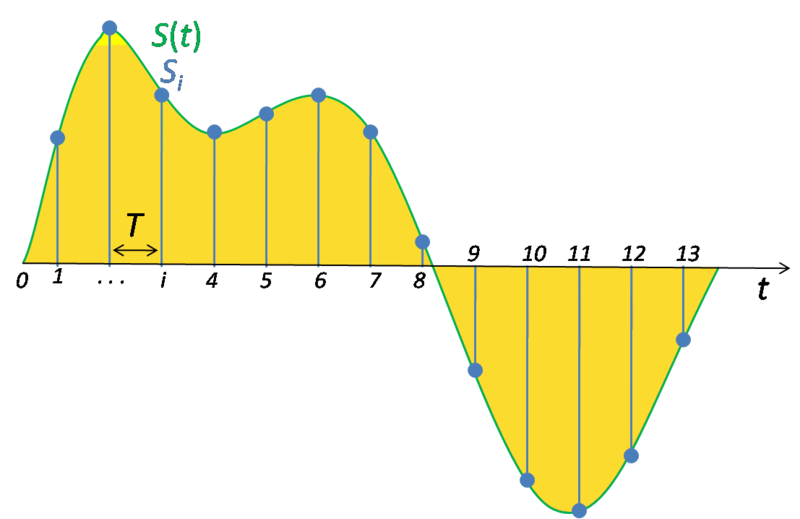
The above figure shows discrete samples in blue, used to approximate the green continuous signal. Photo from here.
Now, let’s consider the rate of which said sampling is occuring. How do you know if you are sampling at an acceptable rate? Without going down the rabbit hole too far (again) there is a way to determine what sampling rate is appropriate for your data/signal acquisition that is commonly referred to as the Nyquist sampling theorem. There is a lot of available literature on the subject should you choose to pursue a more in-depth exploration, but the takeaway is that the Nyquist sampling theorem states that a signal must be sampled at a rate of at least twice the highest frequency of the signal. For example: also remembering that most signals are composed of many frequencies, let’s say I am logging data for a signal whose highest frequency is 6 kHz. Therefore, I should be sampling at at least 2 times 6 kHz, or 12 kHz.
What happens to your data if you are samping below or above this Nyquist rate? Avoiding yet another rabbit hole, sampling under the Nyquist rate introduces what is called aliasing. Essentially, aliasing is a misinterpretation of the sampled signal or data during interpolation. A common example of this is called the Wagon-wheel effect where, for example, a wheel is spinning at a fast enough rate that your eyes cannot process the images fast enough and the wheel spokes start to perceptively spin slower, not at all, or even in the opposite direction. You might encounter this watching movies where the camera’s frame rate is less than twice that of the rate of a spinning wheel that is in the shot. Aliasing is not restricted to visual processing, but can happen with data and other signal processing.
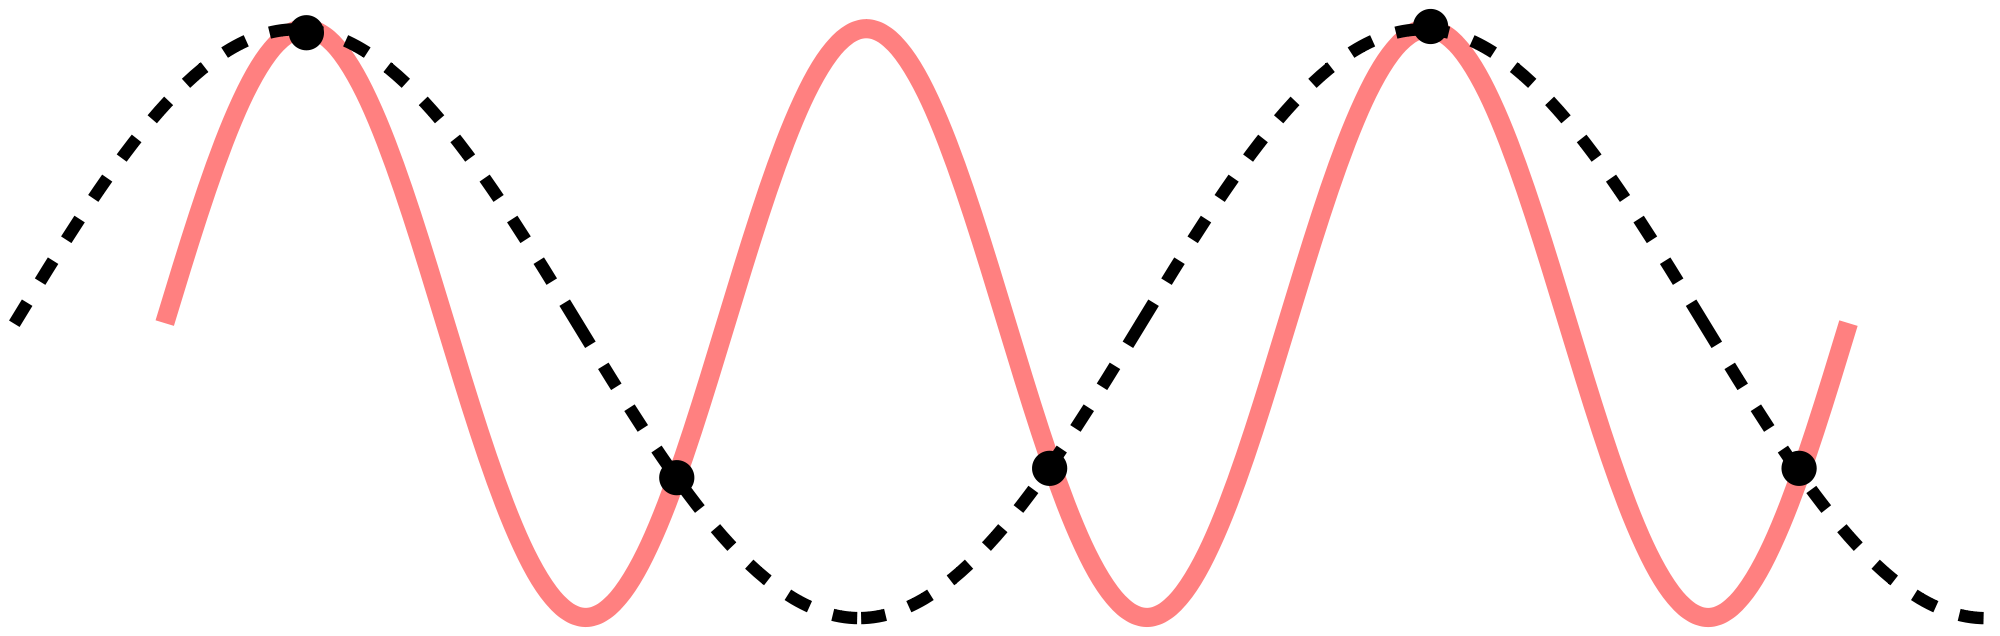
The above figure illustrates sinusoidal aliasing. The pinkish curve was the the original signal, the dots are the sample points, and the dotted curve is the resulting approximation. Notice that the data would show a sinusoid of lower frequency. Photo from here.
Now, it is recommended to sample at a rate slightly above the Nyquist rate as a buffer to help prevent any aliasing. So just sample at the fastest rate possible, right? Well, that takes larger amounts of memory, power, and does not necessarily provide “better data.” In audio sampling, extreme oversampling can result in what is called ultrasonic intermodulation distortion, which is basically sampled inaudible frequencies that actually degrade the audible frequencies.
The rate you sample at is up to you to decide, depending on the data you are trying to acquire. If you are trying to capture an event that starts and ends within a matter microseconds, then you will need to sample at a very high rate. Using WaveForms Live (open source browser and mobile instrumentation software), the OpenLogger (also open source) can sample up to 400k samples per second (400kS/s) which can accurately log data occuring at frequencies as high as 200kHz. Now, that’s quick on the draw, especially with its 16-bit resolution. Again, though, your choice of sampling rate should be realistic for your data acquisition, and should lean more towards staying above the Nyquist rate.
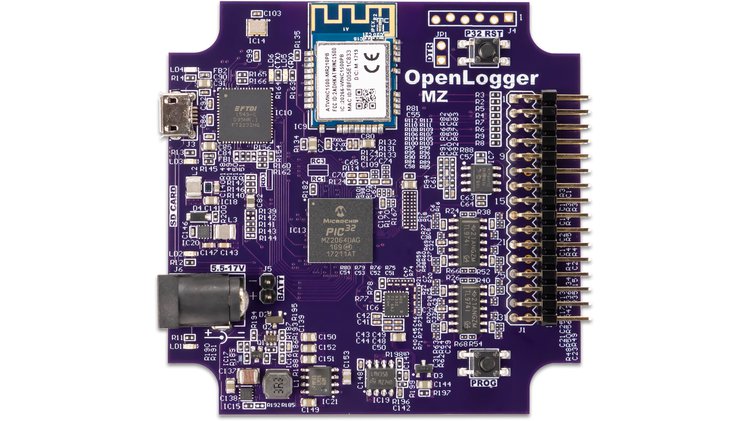
Make sure to head over to the OpenLogger Crowd Supply page and to follow its development!