
If you’ve spent any time at all, even a few minutes, with any electronics you should know how important transistors and diodes are. They are absolutely everywhere and in everything. The trick with semiconductor material is that performance characteristics will vary between individual components. Less so if they come from the same production batch, but there will always be variances. This is why it is better to use transistor array ICs if you need to use several transistors in a project. When built into one single piece of silicon, variances are kept to a minimum and devices are generally considered as closely matched as possible.
But what if you don’t have a transistor array IC? How do you determine if two devices have similar characteristics and are a good match? One way to do this is to use a curve tracer, which plots the current vs. voltage of semiconductor devices on the same graph to make interpretation easier. Unfortunately new bench-top curve tracers are expensive to purchase, and old ones are still expensive and usually decades old, requiring vacuum tubes to keep them running. They are pretty cool and very reliable though. Luckily current technology allows for high performance and low cost at the same time, which is where the Analog Discovery 2 comes in.
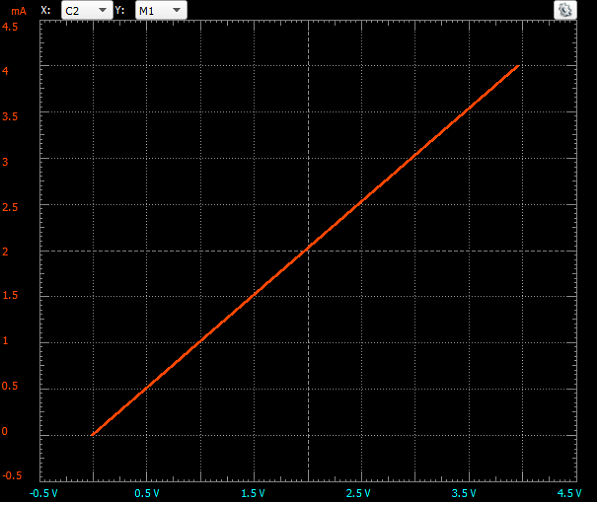
Linear devices like resistors produce a very straight-line plot of current through the resistor vs. the voltage drop across the resistor, as seen below.
On the other hand, non-linear devices like diodes and transistors have very… wait for it… non-linear behavior regarding how the current through them changes to differences in applied voltage or current.
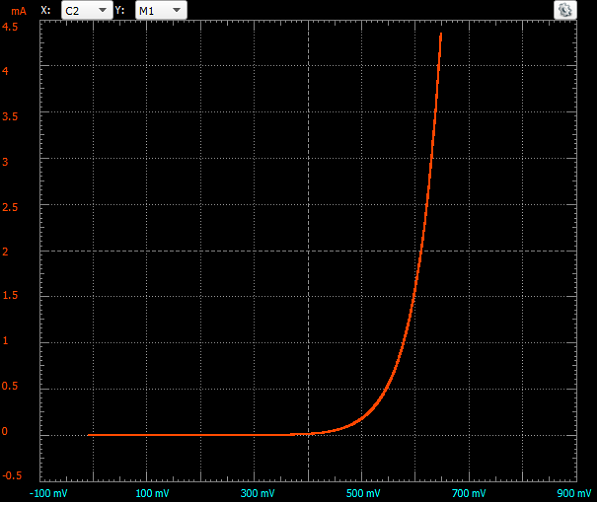
The challenge with non-linear behavior is capturing the data in order to determine performance characteristics so that devices can be properly matched. This is where curve tracers are so useful. The two images above were captured using the Waveforms 2015 software and the Analog Discovery 2 and show the current-voltage relationship of the device under test. The two-channel, time-dependent oscilloscope data was manipulated in software to plot the diode voltage drop on the X axis and the device current on the Y axis.
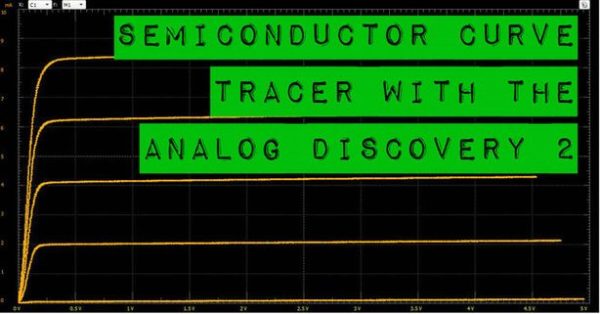
To learn how to manipulate the Analog Discovery 2 and Waveforms to work as a semiconductor curve tracer, head over to my Instructable.
Hello Guys please help me . my Project Title. USB oscilloscope software interface for diode characterisation.
Project Description The Analog Discovery USB oscilloscope is supplied with an API (application specific interface) to program your own software. This project will design a software interface to enable the oscilloscope to characterise diodes.
Please guide me.
Thank you .
I will be using Analog discovery with waveforms and python script. Please help me