
Today we will take a look at one of the most useful tools on the Analog Discovery 2 (the oscilloscope) and how it can help you refine, tweak, and improve your projects.
Oscilloscopes are one of the most important and useful tools for any electronics engineer or hobbyist. The problem with most scopes is that they can be expensive and they tend to take up a large amount of valuable bench-top real estate.So it’s a good thing you can use your Analog Discovery 2 oscilloscope tool to save both money and space!
Scopes work by plotting the data sensed by the probes onto a graph, which is then displayed on a monitor of some kind. The x-axis is set to display time, and the y-axis can be set to display whatever data type is under observation. Let’s look at a simple RC circuit to illustrate this.
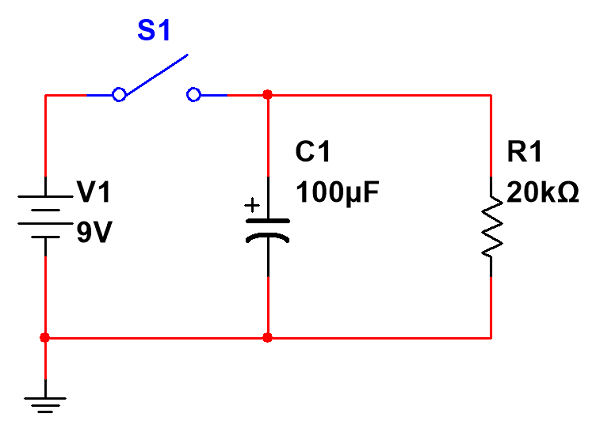
When the switch is closed, the capacitor charges but quickly reaches full capacity. Once it does, it acts as an open break in the wire and the voltage across the resistor and capacitor is the same voltage as the battery. Once the switch opens, the capacitor starts to drain through the resistor. The equation Τ = RC is known as the RC time constant, and tells us that it will take Τ (Greek Tau) seconds for the capacitor to drain to ~36.8% of it’s previous value. For our schematic, we get Τ = 20kΩ * 100μF = 2s.
The oscilloscope image of the circuit behavior over several seconds shows a lot of information.
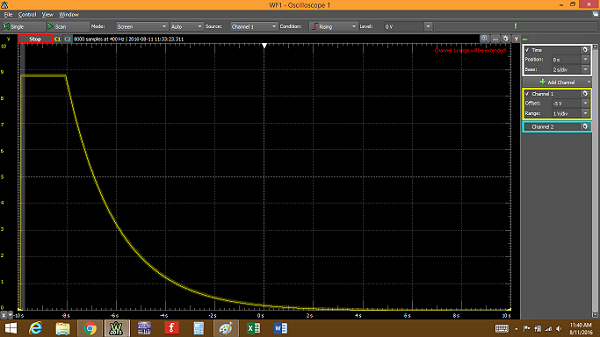
Each large division along the x-axis in this image is 2 s. The voltage on the capacitor starts to fall at about -8 s, which is the time when the switch was open, cutting the power from the battery. The voltage level at this point is about +8.5 V, but it can be difficult to see the data in the above image. We can add cursors to the image to help.
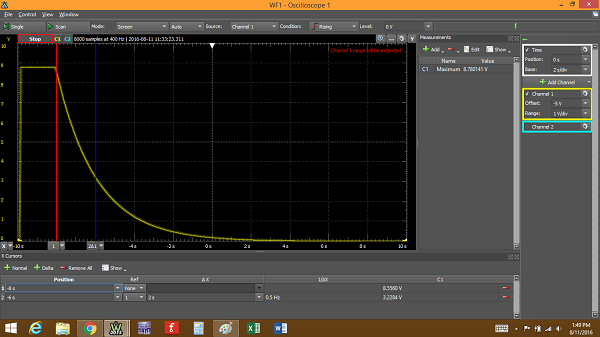
The red cursor shows the exact data captured at -8 s. If we look at the voltage 2 seconds later (blue cursor), we get a voltage of about +3.2 V. Do you remember what the RC time constant represents? It’s the time it takes the capacitor to discharge ~36.8% of it’s present charge through a resistor. If we divide 3.2/8.5 we get about 37.6%, which is right where it should be considering we assumed nominal values for the resistor and capacitor and they each have an error of +/- 5%. Any 2 s time span will show this same drop in capacitor voltage.
This is just a brief introduction to the oscilloscope tool using the Analog Discovery 2 and Waveforms 2015. For a more in depth tutorial, check out my Instructable!