
I’m working on a series of projects that will highlight the capabilities of the Waveforms 2015 software when paired with either the Electronics Explorer Board or the Analog Discovery 2.
If you don’t know yet, the combination of either the AD2 or EEBoard with the Waveforms 2015 software gives you a very powerful, all-in-one, bench-top tool kit without taking up tons of space or completely breaking the bank. You get an oscilloscope, arbitrary waveform generator, digital logic analyzer, digital pattern generator, static digital I/O, voltmeter, network analyzer, spectrum analyzer, digital bus analyzers, and programmable power supplies. There are different options available for several of these functions depending on whether you have the AD2 or EEBoard connected (the EEBoard has more options), but for the average project, either option should work perfectly fine for you.
My first project was the spectrum analyzer. I had never used one, so I was pretty apprehensive. What a waste of nerves on my part. It couldn’t be simpler to use with just a simple plug and play connection.
Spectrum analyzers take in a signal, and then break it down according to what frequencies are most prevalent in that signal. A pure sine wave at 1 kHz is exactly that- a simple sine wave.
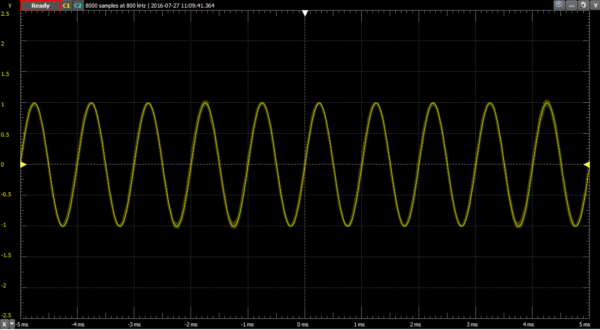
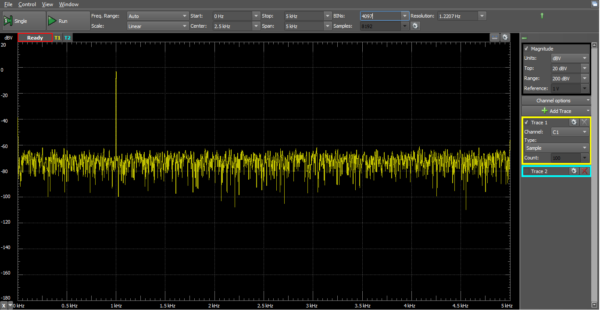
When you connect it to the spectrum analyzer, you will see a spike at 1 kHz, then no other spikes anywhere else. You do get a lot of low level background noise, but it can’t be avoided and it is really, REALLY low level, so you would rarely (if ever) be concerned with it.
So what’s the big deal, right? Well how often have you ever encountered a perfect, ideal situation in life? Because if you have, I’ve got a pet unicorn you can ride on my ocean front property in Nebraska. Let’s take a look at what the spectrum analyzer is really used for, breaking down signals into component sine waves.
First, a little bit of background. All math functions can be broken down into a series of component functions. This is especially true of periodic functions. The idea was first proposed by Joseph Fourier and is now known as the Fourier Series. Any periodic signal can be broken down into an infinite series of sine waves, all of which add to the overall wave, but not all contribute equal weight.
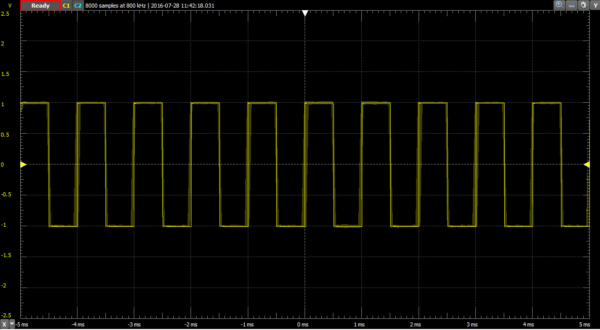
The idea can be confusing, but we can easily demonstrate it by looking at a simple square wave. Here we see a 1 kHz square on the oscilloscope.
Here’s the same signal on the spectrum analyzer.
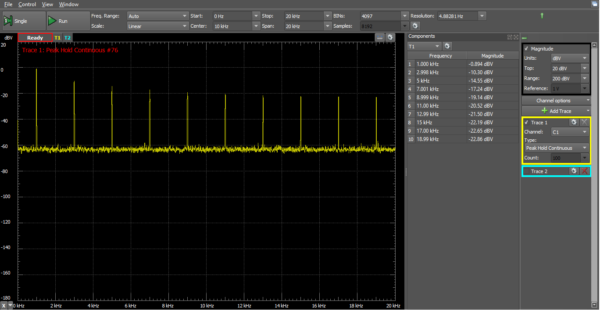
With this image you can see that a square wave is actually the combination of an infinite series of sine waves, each one being an integer multiple of the base frequency. The base frequency also has the highest strength, or magnitude, and each of the other frequencies contributes less and less to the overall wave form. But they are all still there.
You can use spectrum analyzers to break down known signals, as shown above. You can also use them to find anomalous signals that are causing problems with your circuit but aren’t actually part of the circuit. We are surrounded by EM radiation 24/7, and any wire or copper trace in a circuit is subject to induced currents when the right EM energy comes whizzing by. Sometimes it comes from the hard wire connections as well, like the 50-60 Hz noise that is extremely common on electronic devices that are connected to AC mains power.
Below we see the spectrograph of my EEBoard with no signals being input and nothing connected. It’s just turned on and running, with channel 1 from the spectrum analyzer plugged into a random hole on the built-in breadboard.
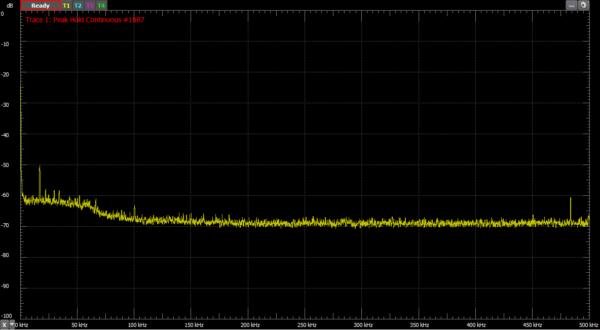
Take note of the several large spikes, but also notice the large hump of noise between 0 and ~60 kHZ. Almost every frequency in that range is contributing slightly more than standard background level noise to the system, with a decent number of fairly large spikes over background. And without testing I don’t have a clue what is happening at ~470 kHZ.
The spectrum analyzer is an extremely useful tool. I’m excited to be getting into the rest of the tools on the Analog Discovery 2 and Electronics Explorer Board with the Waveforms software.