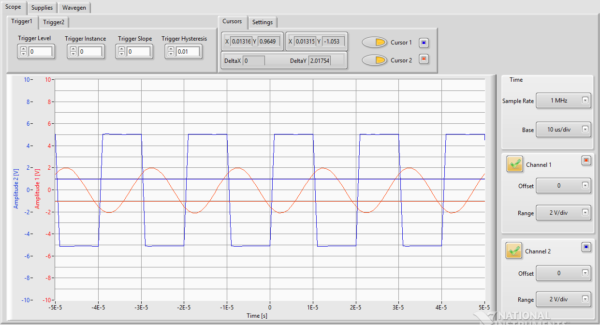
Currently, the Analog Discovery 1 & 2, the Electronic Explorer board, and the OpenScope MZ all have the ability to connect to LabVIEW. But with Waveforms and Waveforms Live being so easy to use it might be tough to understand when you would need to use LabVIEW. In this post, we will go over some of the advantages of using these tools in LabVIEW.

Raw data does not always immediately convey useful information. Often, scientists and engineers must transform the signal, remove noise disturbances and compensate for environmental effects. For that reason, signal processing is a fundamental need in nearly all engineering applications. LabVIEW gives you the ability to filter data in real time, it also provides tools for saving your data or exporting it to other applications. This allows you to combined analysis with data acquisition and data presentation, which is often not possible in other software development environments.
Signal Analysis Express VIs
Configuration-based Express VIs provide the simplest way to add inline measurement analysis and signal processing to a LabVIEW application. The many signal analysis Express VIs provide a configuration approach to LabVIEW development and encompass the capabilities of many lower-level signal processing.

With Express VIs, users can interactively explore the various analysis algorithms settings, while immediately seeing the results in the configuration dialog. For example, the Filter Express VI provides tools to configure such digital filters as lowpass, highpass, bandpass, and bandstop. The configuration dialog for this Express VI provides controls to interactively configure filter settings.
Other remaining signal analysis Express VIs include the following high-level functions:
- Amplitude and Level Measurements Express VI
- Align and Resample Express VI
- Spectral Measurements Express VI
- Distortion Measurements Express VI
- Tone Measurements Express VI
- Amplitude and Level Measurements Express VI
- Timing and Transition Measurements Express VI
- Curve Fitting Express VI
- Statistics Express VI
- Convolution and Correlation Express VI
- Simulate Signal Express VI
- Mask and Limit Express VI
- Align and Resample Express VI
Data storage and reporting
LabVIEW is designed for the entire engineering process, it includes built-in functionality to help you easily save data to disk and create professional reports. By providing easy yet robust interfaces for file I/O and reporting, you can make the most of your acquired data to make decisions faster. As each application is different, LabVIEW contains a wide array of file I/O options for you to choose from, including ASCII, binary, datalog, ZIP, and XML.
LabVIEW includes basic functions you can use to build files from scratch as well as Express VIs for configuring file I/O parameters from a dialog so you don’t have to worry about details such as opening file references, string formatting, and endianness. Because good file I/O practices can be one of the trickier parts of building any test or measurement system, LabVIEW ships with dozens of examples that you can use to get started with each of the file types.
While LabVIEW is often viewed as primarily a measurement tool, it also gives you the ability to filter data in real time and it provides tools for saving your data or exporting it to other applications. These signal processing functions give engineers and scientists with the ability to extract useful information from measurement data as it is acquired. If you are interested in trying out LabVIEW for yourself, you can purchase a copy of LabVIEW 2014 home edition which includes everything you will need to run LINX 3.0.
